
Invoice and Expenses
Tracker Googlesheet
User Guide: Overview
This spreadsheet comprises 4 tabs: Setup, Invoice Tracker, Expenses and Summary and allows you to track up to 480 invoices and expenses over a period of 12 months.
The summary tab collates all of your information into a series of tables and charts which you can filter, based on the information you have inputted into the other tabs. Cells which contain formula used to process your information are protected. If you accidentally type into one of these cells, you will see an alert to warn you.
These instructions apply to both the light and the dark versions of the spreadsheet – they are identical except for the colours.
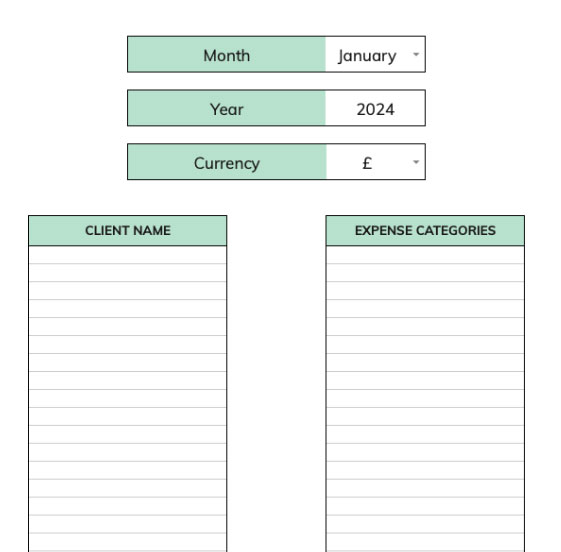
01: Setup tab
The purpose of this tab is to input information that you will reuse in other tabs. It is fairly straight forward and can all be edited & changed further down the line if you need.
- Select your start month for the 12 month period from the dropdown
- Type in your starting year
- Select your currency from the dropdown
- Add the names of your Clients (these names will then be selectable via a dropdown in the Invoice Tracker tab)
- Add your Expense categories (which will then be available in the Expenses tab as a dropdown)
- You can input up to 100 Client names and Expense categories
02: Invoice Tracker tab
This tab is the heart of the spreadsheet where you capture all of your invoices. You can record up to 480 invoices for your 12 month period (and duplicate the spreadsheet if you want to use for more than 1 year):
- The columns with the yellow boxes at the top require you to enter your information. The columns with the grey boxes at the top are calculated and will auto fill as you input your information.
- Under CLIENT NAME, you can select any client that you entered in the Setup tab from the dropdown. If you add new clients, they will be available in the dropdown. If you remove or edit a client name that is being used in this column, you will need to select another name via the dropdown to remove the error message and red arrow (the error message simply indicates a name has changed)
- The next 3 columns (CONTACT, INVOICE ID and YOUR NOTES) are optional and are there if you want to keep a record of this information. If you do not want these, columns you can hide them, by selecting the column at the top by clicking on the letter, then right clicking and select ‘Hide Column’ in the dropdown. Or just leave them blank if you prefer.
- In the INVOICE STATUS column, you can set the invoice status to Pending, Sent or Paid. This is your visual reference so you know the invoice status, and you can update this at any time.
- Input the DATE SENT and DUE DATE by double clicking into the relevant cell and select a date from the calendar picker. The PAYMENT STATUS column (to the right) will then either show “Due” or “Overdue” based on the dates you inputted.
- When you set the INVOICE STATUS to be “Paid”, this will be reflected in the PAYMENT STATUS as well, and the relevant cells will be highlighted green so you can quickly and easily see what has been paid.
- If the DUE DATE is set before the DATE SENT, you will see “Due Date error” in the Payment status column which is easily rectified by changing either the due or sent date
- Once you mark an invoice as Paid, the PAYMENT STATUS cell will update as will the AMOUNT PAID cell, which will automatically show the amount you invoiced. If your client paid you a different amount to the invoice, you can overwrite the number shown and the DUE column will reflect the under or overpayment.
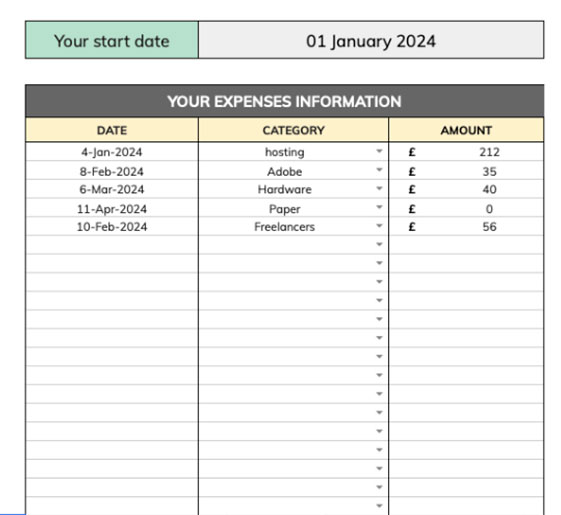
03: Expenses tab
This tab is for you to input your expense data, using the categories you created in Step 1.
- Select a date for your expenses entry by double clicking into the cell to open the calendar picker
- Select your Category from the dropdown (this is from the Setup tab – if you wish to add, remove or edit expenses just go back to the Setup tab and change accordingly)
- Input the cost of the expense
- You can input up to 500 expenses.
04: Summary tab
The summary tab presents you with the breakdown of all the data you have inputted:
- At the top you will see your Totals to date, listing your Invoiced figure along with your Income (what you have been paid), your Expenses and finally your income net of Expenses.
- Under the totals on the left your will see your Top 10 clients for the year, which can be filtered via the dropdown either by your top 10 invoiced or your top 10 paying clients (the variation will relate to when they pay and invoices that are due, but unpaid). These are displayed as a bar chart and a table
- Beneath that is your largest 10 expenses for the year
- On the right handside is your monthly breakdown which you can filter by Amount Invoiced, Amount Paid and Expenses, represented as a pie chart and a table. Additionally, the table shows your monthly income net of expenses.
- In the second half of the tab, you can see on the left your Top 10 Expenses again represented as a bar graph and pie chart.
- On the right, you will find the detailed monthly breakdown for your chosen month. Simply select from the dropdown which month you want to see the breakdown for. This will display up to 40 invoices and expense categories for any selected month.
- Please note, the Summary tab will only report for 12 months. If you have inputted invoices or expenses outside of the 12 month period (defined from the start date in the Setup tab), then these will not show in the summary. However if you can change the start date to adjust the reporting time (or duplicate the sheet if you want to have more than 1 year)